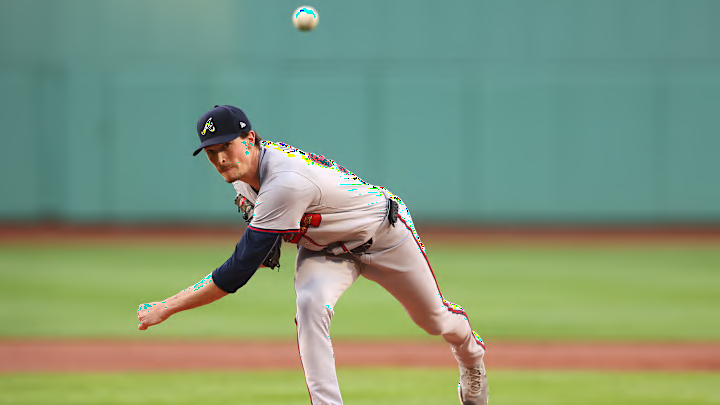
The Braves have been going through a rough patch for a little while now, but with a 36-30 record you might not know it. Truth be told, the Braves lost some games they should have won and struggled against teams that they should have defeated. While this happens to every team, the Braves’ problems are quite concerning.
The lack of offense and inconsistency of their starting rotation warrants at least some worry. It might be the lofty expectations we as baseball fans carry with memories of last year that highlight the perceived insurmountable underperformance of a good team, but behind the curtain, there is still championship potential. Yes, the Braves have problems, but the season is far from over.
There isn’t much of a need to remind the baseball world that the Braves’ record is still very good. But there is a vast disconnect when we feel like this winning team is helpless to win certain ballgames. Why is this? Even in the most puzzling of enigmas, there is a method to the madness. A dive through some relevant Braves’ stats can summarize their season fairly-well.
A look at the Braves’ offensive production
To start, let’s look at the offense. The Braves sport a fantastic 6.3 barrels percentage (Brls/PA%) as a team which placed them fourth in MLB in barrels. Strangely, this doesn’t translate into a superior number of runs scored. The Braves currently average 4.32 runs per game. This places them 16th in baseball in runs per game.
As it stands, this number isn’t very good, not awful, but not good. This should be a concern to any team with postseason ambitions such as the Braves. One stat that might explain the lack of runs despite the great barrels number is on-base percentage, which the Braves have so far posted a .309 OBP. This places them T16th in MLB in on-base percentage, also not good. What’s worse is that the Braves are 21st in runners left on base per game (1st being least runners left on base, 30th being most) with 14.65 on average.
This is in part due to the Braves’ high strikeout rate. On average, the Braves rack up 8.66 Ks per game, placing them 20th in the MLB (again, 1st being least Ks per game, 30th being most). In both runners left on base and in team strikeouts, the Braves lag around 2/3 of the thirty MLB teams.
So, the lack of runners on base combined with their inability to get runners across the plate when they do make it on has cost them greatly this season. In addition, these numbers don’t fully take into account the injury of Ronald Acuna Jr. since he has played in most of their games so far this year.
The loss of a leadoff hitter with Acuna’s ability to produce runs should prove detrimental to the team’s productivity. But the promising story here is the Braves’ pitching staff. While it isn’t all roses and sunshine, there is plenty to like here.
The Braves’ pitching staff is both concerning and promising
Before we analyze the stats of the Braves' pitching staff, let’s first take a look at each spot in the rotation that is occupied by a consistent starter.
ERA | Win-Loss | Result | |
|---|---|---|---|
Max Fried | 3.20 | 6-3 | 9-4 |
Chris Sale | 3.01 | 8-2 | 8-4 |
Reynaldo Lopez | 1.69 | 4-2 | 7-4 |
Charlie Morton | 4.12 | 3-3 | 5-7 |
When Fried, Lopez, and Sale take the mound, the Braves are winning a lot of ballgames. When Morton and the various fifth starters take the mound, the Braves are understandably struggling a bit more. Part of the reason why Fried and Sale have contributed so much to the win column besides great pitching performances is that they often go deep into games sparing the bullpen from working.
Most times, when Fried and Sale take the mound, it doesn’t require much from the offense to win. This is also why Lopez and Morton, though they are currently winning pitchers, have seen less success in the game resulting in wins.
The point here isn’t to trash the bullpen which has done well at times though it has experienced injuries of important relievers and endured times of inconsistency, but to point out what has been hindering the Braves. First and foremost, one of the largest problems the Braves have experienced is the lack of a reliable 5th starter.
To date, the Braves have a 3.69 ERA as a team, ranking 8th in MLB. Even if the Braves don’t acquire a star pitcher to fill the 5th spot, a decent arm that can eat innings and still throw quality outings can work wonders for them. Even so, this current pitching staff is a vast improvement over the Braves’ staff that pitched to a 4.14 ERA last year.
There are plenty of areas where the Braves can improve. The loud offense we saw last year has been hampered by injuries and below average production. With that said, the barrels percentage is still very encouraging. Should the Braves work on grinding at-bats, cutting down on strikeouts, and getting on base any way they can, we might see the runs per game number launch way up.
Even with their struggles, there is still a lot to like about the Braves. If the fifth spot in the rotation is filled with a good arm, it will be very interesting to see what happens with the Braves’ record and how any success they find in the regular season translates to the postseason.
