The game’s changed, and relievers are picking up wins for getting as little as one out, so 20 wins alone won’t mean much. Voters look to ERA, FIP, and a host of assorted metrics to decide their vote.
However, this year’s voters have a problem because the most used metrics contradict each other. Voters must make their decision based on who the pitcher posted numbers against and what it meant when he pitched: the dreaded eye test. Shocking, isn’t it?
The Voters’ Dilemma
On the 18th, Rob Mains penned (or typed, I guess) The Advanced Stats Don’t Always Agree. And That’s Just Fine for Baseball Prospectus, discussing some of the specific issues voters faced when considering the pitchers most talked about in the media.
I’ve said often over the years that leaning heavily on one statistic for anything is a bad idea. Mains explains why using four stats related to pitching that factor into the flavors of WAR (rWAR, fWAR, WARP): FIP-, ERA+, DRA-, and xERA. (Emphasis added is mine.)
"The four advanced metrics—and the valuation statistics based on them—all measure pitcher quality. But …in slightly different ways. That’s fine. Each imparts information. That’s not a flaw, …They’re all valuable. They’re all imperfect. They all have their place.Rob Mains
The fact that they don’t all agree on (pitchers)? Think of it as a feature, not a bug."
I have suggestions for the voters. They will, of course, ignore them, but I’ll lay out the case for my choice by looking at what and how the pitchers performed with no further notice WAR for pitchers.
Who is the best pitcher in the league?
Earlier in September, Dan Epstein wrote that Blake Snell’s Cy Young Case Doesn’t Pass the Sniff Test because his 13.5% walk rate is the worst for a starting pitcher in the MLB. He got away with all those walks because of an 86.2% strand rate. Because he’s flawed, voters will look for an easy-to-understand number they can write about that fans will understand.
There are five pitchers with numbers better than Snell who are having a season significant enough to get some attention and play for teams who have a postseason spot locked up or are in the hunt. ; Strider, Zac Galen, Justin Steele, Logan Webb, and Zach Wheeler.
The Candidates
Steele’s 3.00 ERA is second to Snell, and his 69% QS is second only to Logan Webb’s 72. He isn’t a strikeout pitcher (24.5%), but his 5% walk rate – a number he shares with Wheeler, is the lowest in the group.
Webb’s 22.9% K-rate is the lowest in the group, but he walks a minuscule 3.8% of batters, and his 72% QS rate and 3.35 ERA over 207 innings. I don’t understand why no one’s talking about Webb. Well, I do, he’s not flashy, and the Giants aren’t winning, but Webb’s had a great season.
Galen’s has a disappointing second half, and the law of recency will likely end his chances.
We know Wheeler pretty well, he strikes out 27.2%, walks 5%, and pitched to a 3.63 ERA over 181 innings so far. He’ll get votes, but there’s not a lot of noise around him.
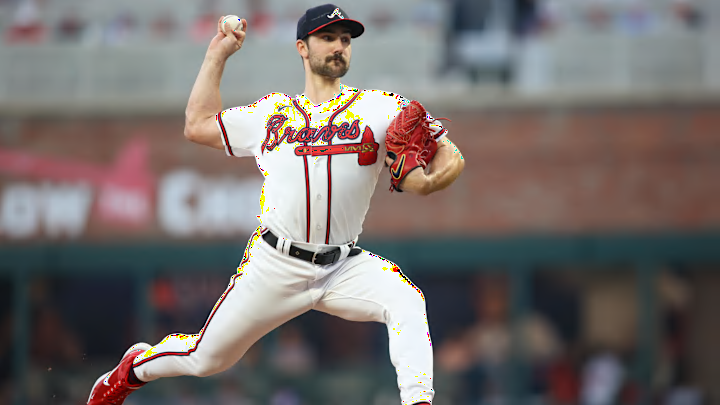
Strider has the strikeouts and the style. Everyone except his opponents likes to watch him pitch. His 37.9% K rate reminds me of Nolan Ryan when he burst onto the scene, but he walks 7% of batters. The Atlanta Braves feed off of his energy, and unlike some power arms, he’s quickly learning to pitch rather than throw,
