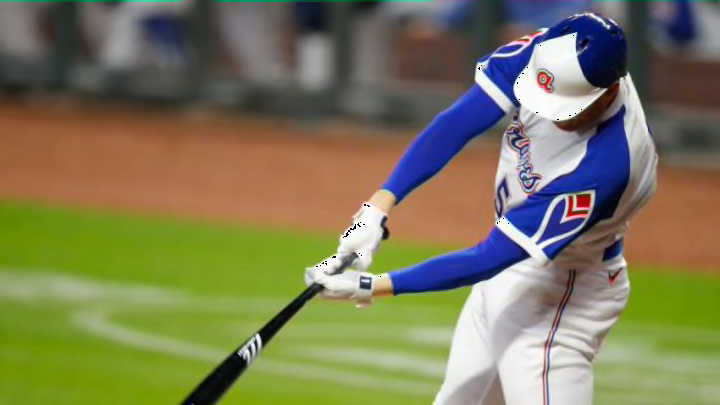
The Atlanta Braves have heated up at the plate. In the last series against the Phillies, they scored 19 runs in only 3 games to average 6.33 runs per game.
The offense has been a lot better than it was the first time the Atlanta Braves played the Philadelphia Phillies this year. The last time they played them, the Braves only scored 3 runs total. Both times they faced the Phillies’ arguably second-best starter in Zack Wheeler, who pitched like an ace the first time he pitched against the Braves.
Where did this Atlanta Braves offense come from?
The Braves just scored 19 runs in 3 games. There is no way we could have seen this offense coming, right? As a matter of fact, we could. After the first series in Philly the Braves had the worst batting average of balls in play (BABIP) in the league with a .175. BABIP is not an exact science, but it can be used to make well-educated projections.
BABIP is a full article all in itself, so let’s keep it simple. In a nutshell, if you look at a player’s career BABIP, you can tell if he has been lucky or unlucky. Likewise, you can tell if he is in for progression or regression. For example, if a player averages a .300 BABIP, but is currently at .200, you can expect an uptick in offense.
The same can be said for teams as a whole. Although, since there are new players on a team every year, it is safer to look at the league average BABIP and go from there. For reference, currently the Tampa Bay Rays sit right in the middle with a .292 BABIP.
The Atlanta Braves‘ BABIP has jumped .075 to .250 since that first series in Philadelphia
If you close the gap even further, the Braves’ BABIP for the most recent series where they scored 19 runs, their BABIP was .299 (12th in the league in that time span). It is amazing what can happen when your output starts to match the quality of at-bats you are having.
There is a correlation between BABIP and the output of runs
Last year, when the Atlanta Braves were 2nd in all of MLB in runs scored, they led the league in BABIP. So far, the Dodgers lead the league in BABIP with .346. The Dodgers are 5th in the league in runs per game, and 3rd in total runs.
The Atlanta Braves are still extremely unlucky
BABIP is used mostly for projections. There are other stats that can be used to help with this as well. Each of the following stats is worth a full article, so we will keep it short and sweet:
- Expected batting average (xBA): Compares batted balls to other comparable hits to determine how probable a hit is. It attempts to determine what a player’s batting average is expected to be based on launch angle, exit velocity, and sprint speed.
- Expected weighted on-base average (xwOBA): Essentially the same criteria as xBA, but for how often a player gets on base. You may have heard of on-base percentage (OBP) before. xwOBA correlates with OBP very well. It should also be noted that since it is “weighted” it attempts to remove ballparks and defense to get the true measure of a player’s performance with regards to reaching base.
- Expected slugging percentage (xSLG): Same criteria as above, but for slugging percentage. Slugging percentage, for those who do not know, is the number of bases per at-bat. This is important because not all hits are created equal. This attempts to show what slugging percentage is expected based on the
Key Atlanta Braves hitters are due for better results
If we look at some key hitters in the Braves lineup, there is reason to be excited that this uptick in the offense will only increase if they continue to perform at the same rate:
- Freddie Freeman: His xBA is .308, but his actual BA is only .167. His xwOBA is .496, but his actual wOBA is only .349. His xSLG is .843, but his actual slugging is .567.
- Travis d’Arnaud: His xBA is .329, but his actual BA is only .267. His xwOBA is .423, but his actual is .325. His xSLG is .648, but his actual slugging is .433.
- Ozzie Albies: Ozzie may be the unluckiest player in the league. His xBA is .299, but his actual BA is .139. His xwOBA is .354, but his actual wOBA is only .190. If we look at his xSLG, we definitely have reason to be excited. His xSLG is .523, but his actual slugging is only .278.
There is reason to be excited for this sudden uptick in the offense. Not only is it not based on good luck, but based on BABIP and other expectancy stats. These same metrics show that the offense will continue to progress in the right direction given the current rate of play.
