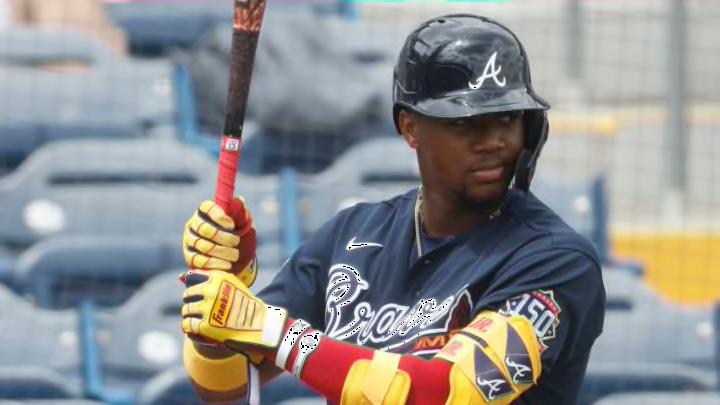
Sure, Soto has the bat. But, in pretty much every other area of his game, the Atlanta Braves’ Acuña has been better.
Acuña excels in baserunning, and not just with steals. He is not elite defensively but is much better than Soto. As most know, Acuña is very good with his bat too. These are not just eye test observations either, the metrics back it up.
Let’s look at the numbers. Some metrics will be used that may seem advanced to some readers, like Wins Above Replacement (WAR), Weighted Runs Created Plus (wRC+), Ultimate Baserunning (UBR), Defensive Runs Saved (DRS), and others. The mathematical formulas are an entire article in themselves, so a brief overview will be used to save time. The research on these metrics is well worth it, and a very interesting read, especially if statistics are your thing.
- WAR: WAR is not the end all be all stat. However, it does a very good job of encompassing a full body of work from a player. It is an accumulation stat that factors in offense, baserunning, and defense at a very granular level down to adjusting value based on which position is played. It measures it by wins, meaning a player with 4.0 WAR would add 4 more wins to their team’s record than a player with 0.0.
- wRC+: wRC+ takes a player’s offensive numbers that they can actually control (like On Base Average, not RBIs that are more manipulated by chance), adjust it based on factors like which ball parks they played in, and how the rest of the league has hit that year, and measures the amount of runs they created all on their own. After all, creating runs is the entire point of hitting. A wRC+ of 100 is league average.
- UBR: UBR factors in all the aspects of baserunning, minus steals, and measures it by runs it creates. We may often forget that there is more to baserunning than just stealing a base.
- DRS: DRS shows how many runs were saved versus the average defender. It measures total defense, like range, route running, etcetera. There is much more to defense than just fielding percentage. A player may get an error on a play that a large majority of players can’t even get to. Likewise, a ball that is hit right at you is much easier to field than one that a player has to have good range to get to. DRS measures this.
Over 313 games, Soto owns an elite slash line of .295/.415/.557. This equates to a wRC+ of 152. That is 52% better than league average. In a very small sample size last year of 47 games, he had an impressive wRC+ of 201. 201 is the highest wRC+ in a season since 2004 from Barry Bonds. We all know there is some debate on whether we should count Bonds stats due to steroids. If we don’t factor in seasons from players connected to steroids, a wRC+ 201 was the highest since Rogers Hornsby in 1924. We need to remember though, rates stats like OBP and OPS tend to regress over long seasons. Odds are that Soto’s wRC+ would have dropped some over a standard season length.
Soto’s offense has been impressive over 313 games, there is no doubt. However, that is where the impressiveness ends. Soto is very much a “one phase of the game” player. Soto has -14 DRS in 2603.2 innings in the field. That means if you took a league average defender and put him in for Soto, approximately 14 less runs would have been scored against the Nationals over that span. Defensive WAR (dWAR) is the defensive factor of Wins Above Replacement. Soto has accumulated -2.9.
From a baserunning standpoint, Soto is not doing himself any favors. Soto did well in 2018 with a UBR of 2.0. Since then, his baserunning has been a disaster with a UBR of -4.2.
From an overall game standpoint, Soto is still very impressive. His lack of defense and baserunning is acceptable with how well he hits. Factoring in his overall game, Soto averages an insanely good 5.69 WAR per 162 games played. For reference, Mike Trout, the consensus best player in baseball, averages a 9.79.
