By the Numbers: How do the Atlanta Braves fare after 20 games?
It’s been an interesting 20 games thus far for the Atlanta Braves.
From the excitement of looking like one of the best teams in baseball, to the heartbreak of seeing key players go down with injuries, it’s been a tumultuous road for the Atlanta Braves so far.
One-third of the way through the season – boy, does it feel weird to say that – there are some definite strengths and areas of concern for the defending National League East champions.
Twenty games has provided a robust-enough sample size for us to accurately gauge how this Braves team matches up against the rest of baseball in the most important categories.
Entering Thursday’s off-day, the Atlanta Braves sit at a 11-9 record – just a smidge over .500, and very indicative of the topsy-turvy feel of the season to this point.
And yet, despite the early troubles, the Braves are one of just five teams in the National League to reach the double-digit win plateau.
The team’s run differential of +16 is also very good, fourth-best in the National League.
But how much of that success can be attributed to the team’s initial hot start – winning 7 out of their first 10, with a team that still had healthy versions of Mike Soroka and Ronald Acuna, Jr?
The narrative has changed significantly of late, so before we dive into the metrics to see where the Atlanta Braves rank in MLB team stats, let’s have that grain of salt in mind.
What the numbers tell us now might not be a clear indicator for how things will unfold over the season’s final 40 games.
Here’s a look at what we do know, so far.
The Atlanta Braves bullpen is quite strong, but the starting rotation is nosediving its way toward the bottom of many MLB ranks.
There’s no surprise element here: what you see is what you get.
The starting rotation for the Atlanta Braves, sans The Incredible Max Fried, has looked really bad of late.
And the metrics agree.
The awful season-ending injury to Mike Soroka aside, the patchwork 2-thru-5 of the rotation has, seemingly on a near-nightly basis, either imploded or struggled greatly to even muster a few productive innings.
It is, of course, a product not just of the Soroka injury, but the absence of Cole Hamels, and the unfortunate tailspins experienced by Mike Foltynewicz and Sean Newcomb, each of whom have been shipped to the team’s training site in Gwinnett.
Through it all, the Braves continue to play better-than-competitive baseball thanks to a grade-A tough bullpen that is among the strongest in the game.
Here’s what the numbers say, with team stats provided by Fangraphs.
Earned-run average (ERA)
- Starters’ ERA: 5.57 (27th in MLB)
- Bullpen ERA: 3.05 (7th in MLB)
There’s a clear discrepancy you’ll notice here, as with many other pitching categories. The bullpen is among the best relief units in the game, the starters among the worst.
Fielding independent pitching (FIP)
- Starters’ FIP: 4.72 (18th in MLB)
- Bullpen FIP: 3.61 (10th in MLB)
Both the starters’ and relievers’ FIP are a little closer to the middle-of-the-pack than what the ERAs suggest. The good news here for the starting pitching is that its FIP is nearly a full run lower than the ERA, which indicates (hopefully) better times are ahead.
Strikeouts per nine innings (K/9)
- Starters’ K/9: 7.76 (22nd in MLB)
- Bullpen K/9: 9.60 (15th in MLB)
Neither unit is really racking up the strikeouts from the mound, possibly to be expected given the Atlanta staff’s penchant for getting groundball outs.
Walks per nine innings (BB/9)
- Starters’ BB/9: 4.15 (27th in MLB)
- Bullpen BB/9: 3.39 (12th in MLB)
The bullpen has slipped a bit from where they were in the beginning of the season, and the starters continue to struggle mightily with issuing the free pass.
Home runs allowed per nine innings (HR/9)
- Starters’ HR/9: 1.20 (10th in MLB)
- Bullpen HR/9: 1.02 (14th in MLB)
One thing the starters have actually managed to do well, as a whole, is keep the ball in the ballpark.
Juuust a bit outside…and inside…
The aforementioned troubles that Braves pitchers have had with bases-on-balls is further explained by Fangraphs’ Plate Discipline statistics.
Atlanta Braves pitchers (both starters and relievers) have thrown just 40.6% of pitches in the strike zone, poor enough for 24th in MLB.
This is certainly not a good development for a group of young starting pitchers looking to gain footing at baseball’s highest level.
Soft contact
It’s not all gloom-and-doom for the Atlanta Braves staff, though.
A definite strength for the Atlanta pitching staff is reflected in MLB.com’s Statcast’s measure of hard-hit rate.
Braves pitchers have only seen 33% of all batted-ball events reach the “hard-hit” threshold, good enough for the 5th lowest hard-hit rate in MLB.
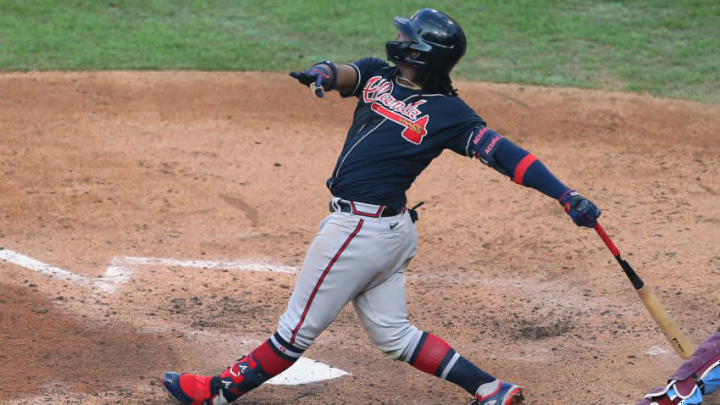
The Atlanta Braves are among MLB’s best teams at hitting the ball hard, which has resulted in one of the game’s best run-producing lineups.
Despite some individual cold streaks here-and-there, and a couple of concerning wrist ailments to the lineup’s talented youngsters, the Atlanta Braves continue to assert themselves as one of the game’s fiercest lineups.
The Braves’ 104 runs scored are the best in all of baseball (only two teams have surpassed 100 runs, the other being the Los Angeles Dodgers, and there’s a simple formula to their success.
Hit the ball hard.
Embrace the Barrel
The Atlanta Braves continue to succeed when it comes to barrels per plate appearance.
Statcast shows they rank third in MLB in this category, knocking a “barrel” 5.7 percent of the time.
Equally as impressive is that Atlanta batters have hit 171 balls in excess of a 95-mph exit velocity, which is 4th most in baseball.
It’s no wonder, then, with their penchant for squaring up on the ball and clubbing it hard that the Braves continue to lead MLB in extra-base hits (doubles, triples, and home runs), with 68 of them.
An Offensive Identity
Twenty games in, and we can certainly distinguish the M.O. of this Atlanta Braves lineup.
They don’t walk quite as much as you’d like, and they strike out far more than you’d like.
To illustrate, the Braves rank:
- 12th in batting average (.242)
- 14th in on-base percentage (.314)
- 29th in strikeouts per 9 innings (28.0) – eek!
- 16th in walks per 9 innings (8.9)
However, this lineup is packed with power, and they flat-out slug their way to high run totals.
In fact, Atlanta sits 6th in team slugging percentage (.438), and their isolated power (ISO) is also elite (.190, 6th best in MLB).
This lineup will frustrate you with their tendency to swing-and-miss, then make you forget all about it with their multi-run homers and extra-base hits.
A Myth of High Strikeouts
If you looked at the Atlanta Braves’ previously-mentioned high strikeout rate, your first thought – like mine – might be that the team perhaps chases too many pitches that they should be taking.
To an extent, that’s true: the Braves have a lineup consisting of a lot of free-swingers, and they’d likely better their odds for a positive outcome at the plate if they exercised a little more patience.
But just because the K-numbers are as high as they are doesn’t mean that the team is notorious for chasing bad pitches.
In fact, Atlanta has shown an aggressiveness for pitches *in* the strike zone, more so than any other team in baseball.
Per Fangraphs, the Braves have the highest Z-swing% (zone swing pct) of all MLB teams at 72.3%.
As far as outside the zone swing rates? It’s not great, but not near as bad as the strikeout numbers would have you believe.
The Atlanta Braves are 10th highest in MLB in O-swing% (outside zone swing pct).
What’s to make of this?
The combination of Atlanta’s embracing of the barrel, coupled with an aggressive approach at pitches inside the strike zone, leads to a boom-or-bust nature within the lineup
The Atlanta Braves are seemingly either striking out or crushing the ball, with not as much in-between as other MLB teams generally see.
As long as the Atlanta Braves keep scoring runs at an elite clip, does it really matter? We’ll see how things develop over the final two-thirds of the regular season.