By the Numbers: How Atlanta Braves stack up vs MLB Through 10 Games

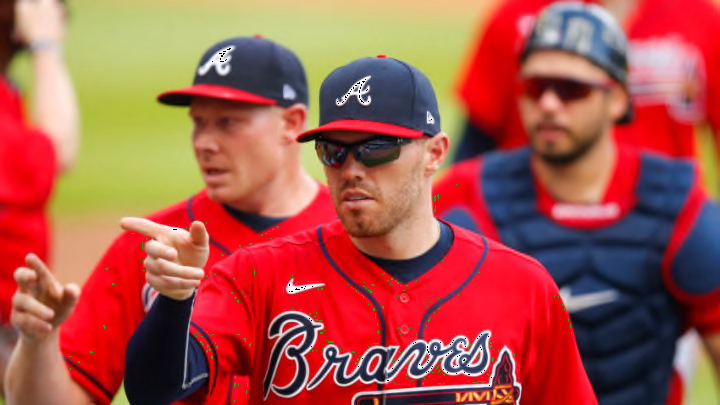
ATLANTA, GA - AUGUST 02: Freddie Freeman #5 of the Atlanta Braves reacts at the conclusion of an MLB game against the New York Mets at Truist Park on August 2, 2020 in Atlanta, Georgia. (Photo by Todd Kirkland/Getty Images)
2 of 3
Next
Ronald Acuna, Jr. #13 of the Atlanta Braves. (Photo by Scott Cunningham/Getty Images)
Ronald Acuna, Jr. #13 of the Atlanta Braves. (Photo by Scott Cunningham/Getty Images) /

The Atlanta Braves are officially one-sixth of the way through this all-too-short 2020 MLB season, and they’ve been very impressive to date.

With 10 games down, the Atlanta Braves find themselves atop the National League East with a 7-3 record largely aided by their current five-game winning streak.

There’s no question the back-to-back division champions are largely a threat to do so again this year, given their hot start.

One question to ponder, however, is just how good is this Atlanta Braves team when stacked up against the rest of baseball?

Atlanta’s seven wins are tied for the most in MLB, and the run differential of +17 is 4th best in baseball, so at first glance the answer to “how good?” is “pretty good,” indeed.

But how’s about a deeper look?

Through 10 games, we’ve now developed a healthy enough sample size to obtain a legitimate picture, especially when you consider that those 10 games account for over 16% of this bizarre season.

With team statistics as the guide, we get a very clear indication as to where the Braves rank in the two major facets of the game: pitching and hitting.

We’ll try to use a nice balance of both traditional team statistics, as well as the peripheral metrics that go into greater depth to tell the true story of performance.

Also, of course, when analyzing these numbers, let’s try to value rates over counting stats (especially considering some teams in MLB have only played 3-6 games due to COVID-19 safety measures), while also taking into account the extreme rates of those teams that have been affected.

For the Atlanta Braves, what are the strengths? Where are the weaknesses? How strong do the Braves measure up to the competition in some areas, and how short do they fall in others?

Let’s dive right in.

Max Fried #54 of the Atlanta Braves. (Photo by Jim McIsaac/Getty Images)
Max Fried #54 of the Atlanta Braves. (Photo by Jim McIsaac/Getty Images) /

The Atlanta Braves pitching has been collectively middle-of-the-road to this point, but it’s definitely not the bullpen’s fault.

There’s a clear distinction that must be made before we go too deep into the numbers here.

While the Atlanta Braves currently rank fairly average – from an overall standpoint – compared to the rest of MLB in terms of most pitching metrics, the statistical difference between the starters and the bullpen is substantial.

This should come as no surprise to Braves fans, who have seen the bullpen pitch well, all the while the starting rotation has seen the bottom fall out behind the strong 1-2 punch of Mike Soroka and Max Fried.

All stats per Fangraphs:

Earned-run average (ERA)

  • Starters’ ERA:  4.70 (16th in MLB)
  • Bullpen ERA: 3.07 (9th in MLB)
  • Overall ERA: 3.89 (12th in MLB)

The contrast is obvious with regards to earned run average: the bullpen has been terrific, the starters have been poor (outside of the SorokaFried tandem, which has a combined ERA of 1.95), the difference producing an overall ERA smack-dab in the middle of all MLB team ranks. Not great, but not bad.

Fielding independent pitching (FIP)

  • Starters’ FIP: 4.57 (16th in MLB)
  • Bullpen FIP: 2.68 (5th in MLB)
  • Overall FIP: 3.63 (9th in MLB)

Fielding independent pitching, FIP, gives us a deeper context of how the Braves’ arms are pitching with regards to factors that only they can control.

The context here shows that both the starters as well as the relievers on the Braves staff are actually pitching better than their ERAs would indicate (good news going forward), though their positions within MLB still fall in similar places in the ERAs ranks.

Strikeouts per nine innings (K/9)

  • Starters’ K/9: 8.39 (19th in MLB)
  • Bullpen K/9: 10.64 (6th in MLB)
  • Overall K/9: 9.51 (8th in MLB)

Not a huge surprise here, given that the Braves’ rotation is mostly composed of groundball-inducing types, though I’m sure it would be a positive trend to see some more whiffs being created by the bottom of the rotation.

Again, the bullpen looks very sharp.

Walks per nine innings (BB/9)

  • Starters’ BB/9: 4.70 (26th in MLB)
  • Bullpen BB/9: 2.05 (2nd in MLB)
  • Overall BB/9: 3.38 (16th in MLB)

This is definitely a tale of two pitching corps.

The starters are one of the worst groups in the majors when it comes to issuing the free pass and getting into less-than-ideal pitch economies.

Meanwhile, the Atlanta Braves relievers have been nothing short of elite in terms of their command in the strike zone.

Home runs allowed per nine innings (HR/9)

  • Starters’ HR/9: 1.02 (13th in MLB)
  • Bullpen HR/9: 0.82 (10th in MLB)
  • Overall HR/9: 0.92 (7th in MLB)

Both the starters and the relievers have performed pretty well with regards to keeping the ball in the ballpark this year.

An unlucky bullpen?

As great as the Atlanta Braves bullpen has performed, they’ve actually been unlucky with regards to batted balls so far.

The bullpen’s .333 BABIP (batting avg on balls in play) against them is actually the fourth highest in all of MLB – which directly contradicts where this ‘pen ranks in most other categories – suggesting that they’ve seen quite a fair share of batted balls drop down for hits at a rate that won’t continue.

Ground game

One other success of both the starters and the bullpen thus far is that they are keeping it on the ground.

Fangraphs notes that the Atlanta staff’s fly ball rate is just 30.7%, which is the lowest in all of MLB!

Statcast supports this development as well, noting that Braves pitchers have allowed for MLB’s third-lowest average launch angle (just 9.8 degrees).
Dansby Swanson #7 of the Atlanta Braves. (Photo by Jim McIsaac/Getty Images)
Dansby Swanson #7 of the Atlanta Braves. (Photo by Jim McIsaac/Getty Images) /

The Atlanta Braves offense scores a ton of runs, racks up a ton of strikeouts, and has some statistical inconsistencies. Confused yet?

This one might make your head hurt.

Let’s get the most important thing right out of the way: the Atlanta Braves are scoring a lot of runs, which is ultimately the name of the game.

Fifty-Seven runs, in fact, through the season’s first 10 games, which is second-most in all of baseball, just behind San Diego’s 59 runs.

So, everything’s great with the bats, right?

Not so fast, my friend.

A deeper look shows the Braves still have plenty of room for improvement, in terms of the offense.

The Good

At first glance, the Atlanta Braves ranks within traditional batting stats don’t immediately jump off the page.

The Braves sit 16th in batting average (.239) and 16th in on-base percentage (.316).

So how exactly does a lineup that’s fairly middle-of-the-pack in both AVG and OBP find themselves second in MLB in runs scored?

Perhaps the best reason for this trend? Extra-base hits.

The Atlanta Braves have an MLB-high 36 of them, tied with the Dodgers.

This tally includes an MLB-leading 24 doubles and 12 home runs.

To conclude, while the Braves aren’t one of the elite hit-for-average type teams in the game, the hits they do often get are the kind of higher-value, higher-impact hits you like to see.

What’s the cause of the extra-baggers? The Atlanta Braves have embraced the barrel.

According to Statcast, the Braves currently possess the 4th best barrel rate in MLB (barrels/batted ball event).

Atlanta Braves hitters are squaring up on the ball, combining increased exit velocity and optimal launch angle, and they are seeing results in the form of extra-base hits.

The Bad

With all the doubles and homers that the Braves hit, imagine for a moment if they had even a moderately higher rate of men on base when those extra-base hits took place.

This could be the case, if not for Atlanta’s poor walk rate.

The Braves’ 9.0 BB% is pedestrian enough for 17th best in baseball.

In fact, of the Braves’ 12 home runs so far this year, exactly half of them have been of the solo variety.

The lack of walks from the lineup isn’t necessarily a “problem,” but it’s definitely an area you’d like to see some statistical improvement, as it could enhance the run output to an even greater level.

The Ugly

Yikes! We knew this one was coming.

It’s the strikeouts. And yes, strikeouts are up across baseball.

But Atlanta is taking it to another level.

The Braves’ K% is 29.8%, or – in other words – next-to-last in all of MLB (only better than the Detroit Tigers).

Should we be concerned?

Now here’s where you’ll ponder on the new-age argument some might make that a strikeout is “the same as any other kind of out,” and that K-rates for a lineup shouldn’t be alarming.

I won’t go that far.

Strikeouts count the same as any other kind of an out, sure, but a lineup that regularly swings and misses to the extent that the Braves do also fail to cash in on run-scoring opportunities by not putting the ball in play.

They’re also the type of lineups that generally see significant problems in October when facing an elite, high K-rate pitching staff in the postseason.

Next. Young SP Stepping Up. dark

Of course, it’s only been 10 games, but this will definitely be something to keep an eye on in the future for the Atlanta Braves offense.

Next