The best Atlanta Braves bullpens ever

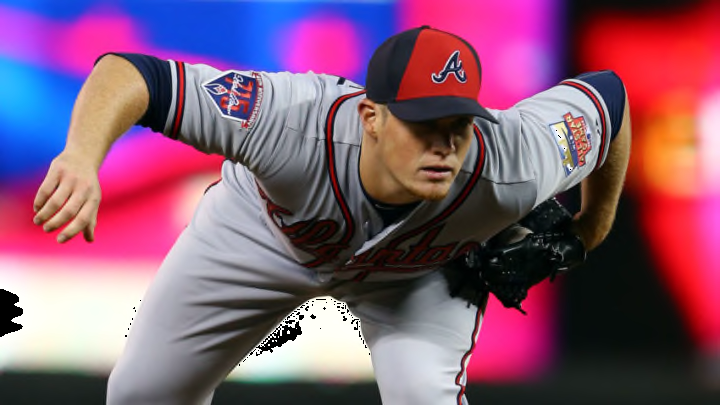
MINNEAPOLIS, MN - JULY 15: National League All-Star Craig Kimbrel #46 of the Atlanta Braves pitches against the American League All-Stars during the 85th MLB All-Star Game at Target Field on July 15, 2014 in Minneapolis, Minnesota. (Photo by Elsa/Getty Images)
2 of 6
Next
ATLANTA, GA – AUGUST 17: Craig Kimbrel #46 and Evan Gattis #24 of the Atlanta Braves celebrate after the game against the Oakland Athletics at Turner Field on August 17, 2014 in Atlanta, Georgia. (Photo by Scott Cunningham/Getty Images)
ATLANTA, GA – AUGUST 17: Craig Kimbrel #46 and Evan Gattis #24 of the Atlanta Braves celebrate after the game against the Oakland Athletics at Turner Field on August 17, 2014 in Atlanta, Georgia. (Photo by Scott Cunningham/Getty Images) /

The pain is real as we’ve watched this 2019 edition of the Atlanta Braves try to find relievers who can throw strikes and retire batters reliably.  But it hasn’t always been so.

The rise of the bullpen era has happened over the past 50 years (+/-), which is roughly coincident with the move of our modern-day Atlanta Braves from Milwaukee in 1966.

At that time complete games were still common:  4 different clubs recorded 52 of them that season (roughly 1/3rd of all games they played) and even a so-so (85-77) Braves team notched 37 behind Tony Cloninger, Ken Johnson, and Denny Lemaster with others filling in the 4th (and final) rotation spot.

There was no designated ‘closer’ then as the term hadn’t come into common baseball vernacular at that time, but managers Bobby Bragen and Billy Hitchcock did rely mostly on Clay Carroll to finish games (28 of them).

Carroll picked up what would later be designated as 11 saves over 144 innings (he also started 3 games himself) en route to a 2.37 ERA.

One thing that surprised me was the notion that 21 different pitchers threw for the Braves that season, despite the number of complete games and the assumption that pitchers generally were not just ‘1 (inning) and done’.

For example, the 1996 LA Dodgers under Walter Alston used just 13 pitchers that year with 4 starters (including Don Sutton) going a minimum of 225.2 innings.

That season, Sandy Koufax went 27-9 with 27 complete games by himself and 323 innings.  Of course, it was also his last season after going 300+ for 3 of those last 4 years (1963-66).

Nonetheless, the entire 1966 Braves staff combined for an ERA well under 4 (3.68) with just 3 walks per 9 innings despite being part of the baseball era where batters avoid the strikeout like the plague.

There are many ways to measure the effectiveness of a bullpen, so let’s look at the Braves history in Atlanta to see which versions were the best at what they did… and maybe that will take our minds off what we’ve been seeing over the past couple of season.

If nothing else… this will be a reminder of just how spoiled we were at various times along the way.

ATLANTA, GA – APRIL 12: A general view of Fulton County Stadium taken during the game between the San Francisco Giants and Atlanta Braves on April 12, 1997 in Atlanta, Georgia. (Photo by: Jim Gund/Getty Images)
ATLANTA, GA – APRIL 12: A general view of Fulton County Stadium taken during the game between the San Francisco Giants and Atlanta Braves on April 12, 1997 in Atlanta, Georgia. (Photo by: Jim Gund/Getty Images) /

5. The Best at Throwing Strikes

You are free to debate whether “throwing strikes” and “avoiding walks” are different concepts or simply two sides of the same coin.

Right now, the notion of avoiding walks is foremost in our minds since our 2018-19 bullpens have developed a particular proclivity to the practice.

Accordingly, this page is dedicated to the Atlanta Braves bullpen that best made sure hitters would have to swing the bat if they wanted to reach base.

1968 BRAVES

During this season, the team still wasn’t especially good (81-81), but they did avoid ‘giveaways’ out of the bullpen.

2.76 walks per 9 innings.

This number was still actually quite a bit higher than the entire staff (counting starters), that being a 2.2 walk rate.  But what’s surprising is that this staff included knuckleballer Phil Niekro, who managed a 1.6 rate.

Cecil Upshaw was the de factor closer on this club, with 116.2 innings in 52 outings, recording 13 saves in the process, but holding hitters to a 1.9 walks-per-9 rate.

Claude Raymond had the 2nd-most relief innings at 60, and he was just under the average at 2.69.  Clay Carroll was still around, too:  2.42 rate with 22 innings in relief.

As a group, they were solid while not spectacular:  a 3.29 ERA overall.

Again, this was an era in which hitters put the ball in play a lot:  stats like FIP (Fielding Independent Pitching) were effectively meaningless because everybody put the ball in play.

  • Strikeouts per 9 innings for the National League in 1968:  5.8
  • Walks per 9:  2.60

So you can see that while this year featured the Atlanta Braves’ best bullpen effort for walks… it wasn’t especially out of the ordinary… though they were 3rd in the NL that season and the best among their Atlanta counterparts in all these years later.
ATLANTA, GA – APRIL 6: A general view of Fulton County Stadium taken during the game between the Chicago Cubs and Atlanta Braves on April 6, 1997 in Atlanta, Georgia. (Photo by: Matthew Stockman/Getty Images)
ATLANTA, GA – APRIL 6: A general view of Fulton County Stadium taken during the game between the Chicago Cubs and Atlanta Braves on April 6, 1997 in Atlanta, Georgia. (Photo by: Matthew Stockman/Getty Images) /

4. Most “Wins” in Relief

I put this word “Wins” in quotes because I am in the camp that recognizes that no pitcher – while standing on a mound – has ever put a single offensive run up on the board.  The best they can do is prevent runs from the opposition and hope to still be present when his mate dent the scoreboard themselves.

That mini-rant aside, there is one Atlanta Braves bullpen that stands alone with a fairly remarkable number of wins credited to their account.

1982 BRAVES (37-24)

What’s also noteworthy for this team is that of the 54 seasons in Atlanta (counting 2019), their 24 losses rank 18th most.  In other words, the bullpen factored in the decision 61 times over 162 games: easily the most in Atlanta Braves history.

This was a playoff team:  89-73 under Joe Torre and winning the NL West before quickly falling to the Cardinals in the NLCS.

But they could pitch.

This bullpen kept the ball in the park (0.63 HR/9, 16th in the Atlanta era), combined for 3.9 fWAR (12th, despite a low-strikeout time for baseball), and persevered over a lot of innings (527… 6th-most among the Atlanta years).

Two pitchers led this group, each with roughly 120 innings in relief:  Steve Bedrosian and Gene Garber.  Both had ERAs in the immediate neighborhood of 2.31 as well.  ‘Bedrock’ struck out more hitters; Garber walked fewer.

Together they were credited with 41 saves (Garber had 30 of them) and 15 wins.

The rest of the wins were scattered between Rick Camp, Al Hrabosky (the ‘Mad Hungarian’), Preston Hanna, Larry McWilliams, Donnie Moore, Carlos Diaz, Pascual Perez (yes, he was on this colorful club, too), Joe Cowley, and Ken Dayley.

As a team, they had a 3.33 ERA, and helped starters Niekro, Rick Mahler, Bob Walk, Camp, and a couple of others navigate through a very interesting year of Braves baseball.

MILWAUKEE, WI – JULY 9: National League All Stars Tom Glavine
MILWAUKEE, WI – JULY 9: National League All Stars Tom Glavine /

3. Best WAR

It would be helpful to define our terms here, though admittedly (a) there isn’t space enough to do this fully, and (b) I would be [poorly] duplicating the work of others.

So for those with the fortitude sufficient to withstand the technical discussion, here is a link to the page in which fangraphs defines WAR for pitchers.

For the rest of us, I’ll summarize:

  • Strikeouts are good (infield pop-ups count the same)
  • Walks and hit batsmen are bad (weighing 50% worse than K’s)
  • Home Runs are terrible (6.5X worse than the strikeout)

WAR is also a ‘cumulative’ stat:  the more you pitch, the higher the numbers will be… hopefully on the good side.

So with that, I present to you…

2002 BRAVES (101-59)

6.5 fWAR out of the bullpen.  No other team was really close (5.7 in 1989; 5.2 in 1993).

15 relievers (2 of which recorded just a single out… both as strikeouts) with 5 of them head-and-shoulders above the rest:

  • John Smoltz.  You may have heard of him.  55 saves in 2002 over 80 innings.  2.5 fWAR.
  • Chris Hammond.  76 innings, 1.8 fWAR.  0.12 HR/9, 83% runners stranded.
  • Mike Remlinger.  68 innings, 1.5 fWAR.  .195 average against, 82% runners stranded.
  • Darren Holmes.  54.2 innings, 1.0 fWAR. 84.7% runners stranded.
  • Kerry Ligtenberg.  66.2 innings, “only” 0.3 fWAR, but .210 average against.

There were more:  Kevin Gryboski, Tim Spooneybarger, Albie Lopez and more.  This group had a 2.60 combined ERA and simply got the job done.

ATLANTA, GA – OCTOBER 04: Craig Kimbrel #46 of the Atlanta Braves reacts after striking out Carl Crawford #25 of the Los Angeles Dodgers in the ninth inning to end Game Two of the National League Division Series at Turner Field on October 4, 2013 in Atlanta, Georgia. (Photo by Kevin C. Cox/Getty Images)
ATLANTA, GA – OCTOBER 04: Craig Kimbrel #46 of the Atlanta Braves reacts after striking out Carl Crawford #25 of the Los Angeles Dodgers in the ninth inning to end Game Two of the National League Division Series at Turner Field on October 4, 2013 in Atlanta, Georgia. (Photo by Kevin C. Cox/Getty Images) /

2. Best Earned Run Average

There are a couple of ways to evaluate ERA… at least… and so we’ll hit on a couple of them here.

There’s the straight/traditional/raw ‘Earned Run Average’… the average runs per 9 innings in which errors did not lead to runs that were scored.

I will add “ERA-” here… a fangraphs concoction that adjusts for ballpark and league factors (similar to the ERA+ used by baseball-reference.com.

This number is scaled to 100:  in the case of both sites, 100 is average, but with fangraphs, the lower you get, the better you are (baseball-reference does the reverse of this).

So then…

Best ERA:  2013 BRAVES (2.46)  (96-66)

Best ERA-: 2002 BRAVES (64)  (101-59)

Both of these clubs also excelled in the other stat:  the 2002 group had the 2nd best Atlanta Braves’ ERA with 2.60; the 2013 team had the 2nd-best ERA- value at 67.

We just talked about the 2002 team, so let’s use this space to note the 2013 relief corps:

Also appearing in relief at various times:  Eric O’Flaherty, Kris Medlen, Cory Gearrin, Scott Downs and others.

Of the entire bullpen (15 pitched in relief overall), only 2 members (Cristhian Marinez at the end of his run, and Cory Rasmus) had ERA’s above 3.80 and four of them got through the year under 2.00.

The leader, of course, was Kimbrel with his 50 saves, 1.21 ERA, and 0.88 WHIP.  And this (arguably) wasn’t even his best season in that early run of his – despite hitting 50 saves.

ATLANTA – APRIL 24: Closing pitcher John Smoltz #29 of the Atlanta Braves receives a congratulatory handshake from teammate first baseman Julio Franco #4 after picking up his seventh save of the season against the Arizona Diamondbacks after the MLB game at Turner Field in Atlanta, Georgia on April 24, 2002. The Braves won 4-3. (Photo by Jamie Squire/Getty Images)
ATLANTA – APRIL 24: Closing pitcher John Smoltz #29 of the Atlanta Braves receives a congratulatory handshake from teammate first baseman Julio Franco #4 after picking up his seventh save of the season against the Arizona Diamondbacks after the MLB game at Turner Field in Atlanta, Georgia on April 24, 2002. The Braves won 4-3. (Photo by Jamie Squire/Getty Images) /

1. The Best of the Bullpens

This is the bottom line… of the 54 bullpens that the Braves have utilized over their years in Atlanta, which group would you want to have out there day after day with a game on the line.

There are definitely some names that you’d want to see back from years’ past, but they didn’t play together during the entire run, of course.

There are names that haven’t even been mentioned in the prior pages worthy of some recognition:  Mark Wohlers, Billy Wagner, Jonny Venters among them.

Fangraphs complies a full “Relieving” score that takes more stats into account.  I didn’t even get into their “Meltdown” and “Shutdown” stats:  times in which pitchers badly failed to help their team win during an outing… or vice versa.

None of the “O’Vent-brel” teams made the list either, though I’ll now throw out an Honorable Mention to one of those:  the 2011 team (Kimbrel/Venters/O’Flaherty/Sherrill/Moylan/Martinez primarily).

That group had the most ‘Shutdowns” (180) and fewer ‘Meltdowns’ (67) than many of the others.

Still, there is one year in which one bullpen stands alone with (easily) the highest total Relieving score (62.8).  They bested the next team by close to 12 points on that metric.

These guys also features 154 Shutdowns and just 66 Meltdowns while earning the most saves in any single year of Braves’ baseball ever:  57.

That bullpen’s record was 30 wins and 14 losses when decisions were made… only in 1 other year did a pen have a highest win percentage.

They also threw the 10th most innings at 512, so it wasn’t like they had lots of rest either.

So for all these reasons, the best Atlanta Braves bullpen was…

More from Tomahawk Take

The 2002 BRAVES

This was John Smoltz’ banner season as a reliever, but he was backed up by an exceptional group of pitchers who simply didn’t give up hits.

Among the top 7 in innings pitched that year, only 1 had an average-against above .210.  If the starter left the game, the game was in good hands:  that’s the long and short of it.

It was a team with very few “name” guys on it:  Hammond, Remlinger, Ligtenberg, Holmes, Gryboski, Spooneybarger, Lopez.

But they didn’t need marquee names.  They were led by one Hall of Famer and yet none of them ever backed down from a hitter.

They didn’t have to.

Next. Let's figure this out. dark

This is what Atlanta Braves fans have been spoiled about and why recent results stand in stark contrast:  it’s the fact that in numerous years, they’ve had a shutdown set of arms that ended games early.  Of those:  these have been the best.

Next