Atlanta Braves 2019 revenues fund higher payroll
By Fred Owens

Baseball income
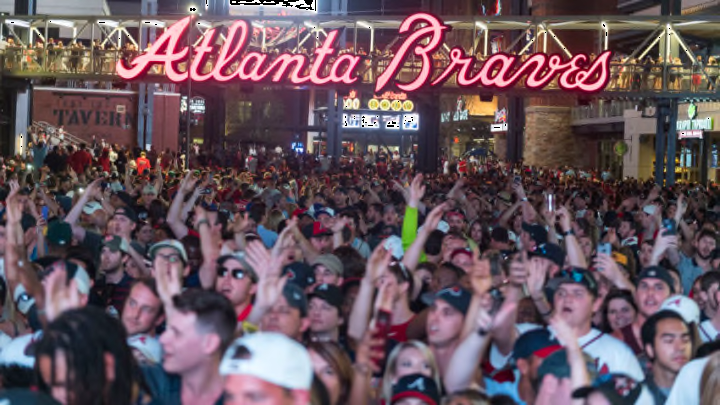
Winning teams draw bigger crowds who spend more money at the ballpark. In 2019 the Atlanta Braves drew 2,655,100 fans to home games – up from 2,555,781 in 2018, a bump of just under 100K fans.
The Braves also received a portion of the postseason gate money, as described in Rule 45 of the Major League Rules. The formula varies slightly with each series:
- each team gets 12.5% each of the gate from mandatory series games, and
- splits the gate-receipts – minus the share going to the Commissioner’s office – equally; I estimate that at 42.5% of the gate each.
In 2018 the Braves had one game more than the minimum in the NLDS, while in 2019 they hosted only two games.
Related Story. If he makes the roster, payroll goes up.. light
The Atlanta Braves took over the management of concessions in 2017, allowing them to keep more money in-house. Postseason play increased income in both seasons and the extra game in 2019.
The difference between the $404M baseball operations income in 2018 and the $438M in 2019 came from the additional games and increased attendance.
It takes money to make money
Operating loss grew and adjusted operating income declined in 2019 because of:
- higher payroll,
- increased costs for the new spring training facility at Northport,
- higher player development costs,
- increased obligations under MLB’s revenue-sharing plan, and
- higher concession related costs due to increased attendance.
General and administrative overhead expenses decreased by $1 million. Depreciation and amortization decreased because of the new facilities and a change in accounting methods required by the government under ASC 842.
Stock-based compensation grew because the value of the stocks grew.
Spreadsheet anyone?
| Braves Operating Results | Twelve months ended | |||||
| Page II-29 of the 2019 Form 10-K | December 31, | |||||
| all figures in millions of $ | 2018 | 2019 | ||||
| Baseball revenue | $ | 404 | $ | 438 | ||
| Development revenue | 38 | 38 | ||||
| Total revenue | $ | 442 | $ | 476 | ||
| Operating expenses (excluding stock-based compensation included below): | ||||||
| Other operating expenses | -265 | -340 | ||||
| Selling, general and administrative expenses | -83 | -82 | ||||
| Adjusted OIBDA | $ | 94 | $ | 54 | ||
| Stock-based compensation | -10 | -15 | ||||
| Depreciation and Amortization | -76 | -71 | ||||
| Operating income (loss) | $ | 8 | $ | -32 | ||
| Regular season home games in period | 81 | 81 | ||||
| Postseason home games in period | 2 | 3 | ||||
| Baseball revenue per home game | $ | 5 | $ | 6 |