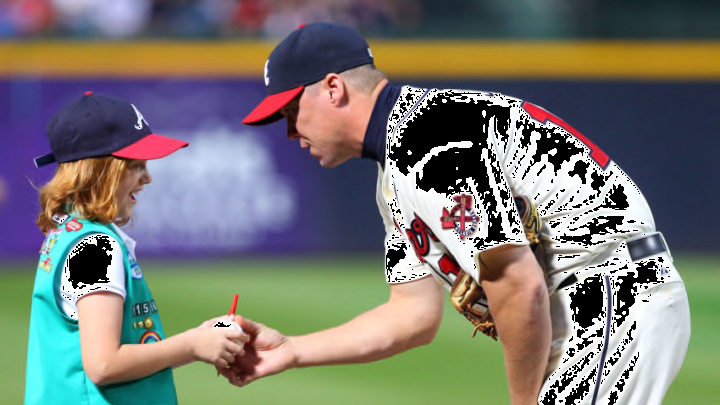
Atlanta Braves recent draft history, Part 1: position players
By Fred Owens

Atlanta Braves drafts since 2001
This review covers draft years 2001 through 2012. The sample size after that isn’t significant when answering the question; excluding them eliminates skewed numbers as much as possible. The table below shows the raw totals for the selected years and a positional breakdown.
| Pos | # | Sgnd | % Sgnd | MLB | MLB% |
| All | 606 | 322 | 53.1% | 61 | 18.9% |
| Pitchers | 332 | 173 | 52.1% | 40 | 23.1% |
| Position | 274 | 153 | 55.8% | 21 | 13.7% |
| LHP | 97 | 57 | 58.8% | 13 | 22.8% |
| RHP | 235 | 116 | 49.4% | 27 | 23.3% |
| C | 56 | 26 | 46.4% | 3 | 11.5% |
| 1B | 26 | 15 | 57.7% | 2 | 13.3% |
| 2B | 17 | 10 | 58.8% | 2 | 20.0% |
| 3B | 25 | 17 | 68.0% | 3 | 17.6% |
| SS | 52 | 30 | 57.7% | 5 | 16.7% |
| OF | 98 | 51 | 52.0% | 6 | 11.8% |
Keep in mind that while the Braves selected Tyler Flowers as a catcher in round 27 of the 2004 draft, he didn’t sign. That decision didn’t turn out well (for him): the following year he fell to the Braves again and they selected him as a first baseman in round 33.
The question:
"I’d like to know the success rate for those within the top 100 picks and outside of the top 100. I would define success at three different levels:"
"Making it to the majors;"
"Becoming a starter for at least two seasons;"
"Making an all-star team or being in the top 10 in significant positive statistics, either offensive or defensive and I’ll defer to your judgment on what those are, though I personally rely a lot on OPS and WHIP."
Instead of trying to sort out which players of the 127 signed players selected were our top 100, I took the easy way out and used all of them.
The top ten rounds provided 44 of the 61 players (72%) who shook hands at least once on a major league roster.
| Pos | RD 1-10 | MLB | MLB % | MLB > 10 | MLB % |
| LHP | 25 | 10 | 40.0% | 3 | 12.0% |
| RHP | 44 | 17 | 38.6% | 10 | 22.7% |
| C | 9 | 2 | 22.2% | 1 | 11.1% |
| 1B | 4 | 1 | 25.0% | 1* | 25.0% |
| 2B | 6 | 2 | 33.3% | 0 | 0.0% |
| 3B | 10 | 3 | 30.0% | 0 | 0.0% |
| SS | 13 | 4 | 30.8% | 1 | 7.7% |
| OF | 16 | 5 | 31.3% | 1 | 6.3% |
| Totals | 127 | 44 | 72% | 17 | 28% |
*Tyler Flowers
I looked at national rankings as much as possible using Baseball America as a source. BA is the only one consistently available over that period, and their staff is among the best in that business.
Of the 136 players selected:
- 2 ranked in the top 25 (Heyward #9, Francoeur #22)
- 9 ranked from 26-50
- 10 ranked between 51-75
- 17 ranked between 76-100
- 20 ranked between* 101 – 200
- 2 ranked in the 300s* (324 and 329)
- 1 ranked 474*
- 74 weren’t ranked*
- 4 ranked players did not sign.
- J.P. Howell #86, second round, 2001
- Kris Harvey #79, fifth round, 2002
- Josh Fields # 58, second round, 2007
- Colby Shreve #185, eighth round, 2007*
*Available rank data – top 100 2001-2002, top 200 2002 –2011, Top 500 2012
Ranks above 200 are shown for general information and are problematic at best.