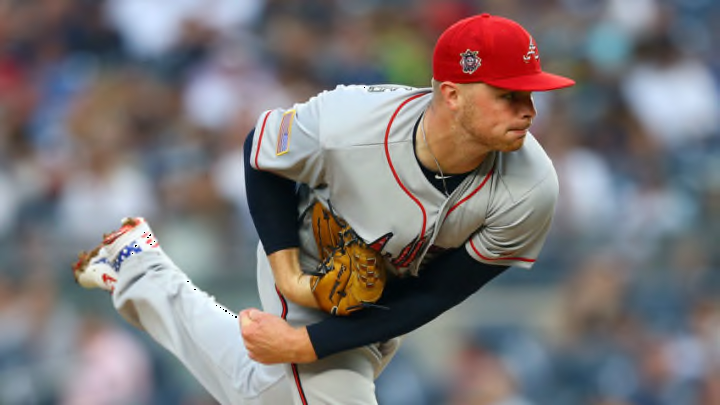
Atlanta Braves Sean Newcomb: talented but inconsistent
By Fred Owens

Batted ball differences
Most of us understand that line drives result in the most hits, the highest wOBA (weighted On-Base Average), and produce the most runs per out.
Likewise, infield pop-ups are the worst kind of ball in play – followed by groundballs (unless the batter possesses blazing speed and knows how to use it).
Fangraphs provides talks about batted ball results and provides league batting averages for each type of contact. These are the league averages today.
| AVG | OBP | SLG | OPS | ISO | Babip | wOBA | wRC+ | |
| GB | .236 | .236 | .258 | .494 | .021 | .236 | .216 | 30 |
| FB | .230 | .225 | .689 | .914 | .459 | .117 | .368 | 133 |
| LD | .682 | .677 | .903 | 1.580 | .221 | .674 | .675 | 340 |
StatCast’s search function provided the data to help me separate Newcomb’s performance with both halves of the Atlanta Braves catching platoon. The differences are pretty easily identified.
| BIP/IP | GB% | LD% | FB% | PU% | |
| Flowers | 4.1 | 32.1% | 20.7% | 41.5% | 5.7% |
| Suzuki | 3.3 | 36.4% | 16.0% | 42.4% | 5.2% |
Suzuki guides Newcomb into coaxing groundballs and popups 41% of the time and stay away from line drives. That reduces opportunities for opposition runs.
When Newcomb gets behind the two catchers have different philosophies about ways to correct the situation.
The first rule of holes: Stop Digging
I noted earlier that Newcomb falls behind batters more often with Suzuki catching; it’s actually about 2½% more often.
When a hard thrower gets behind he can reach back and get a little extra. Newcomb’s fastball lives in the 93-94 range, the lower end of the range for a major league average fastball.
When Newcomb falls behind and Flowers is catching, the fastball is coming about 73% of the time. Suzuki follows the philosophy put forth by former Braves starter and Hall of Famer Greg Maddux.
"“I could probably throw harder if I wanted, but why? When they’re in a jam, a lot of pitchers…try to throw harder. Me, I try to locate better.”"
| Pitching from behind in the count | ||||
| FF | CH | CU | SL | |
| Flowers | 72.6% | 21.5% | 4.7% | 0.6% |
| Suzuki | 67.6% | 29.8% | 1.1% | 1.5% |
The takeaways from this little exercise are pretty obvious. In order to put Newcomb in an optimum position to win he needs five days rest and Suzuki catching. While they are only a few percentage points apart. the fact that Newcomb has a lower ERA, sees fewer batters an inning and has a better record suggest that are significant.