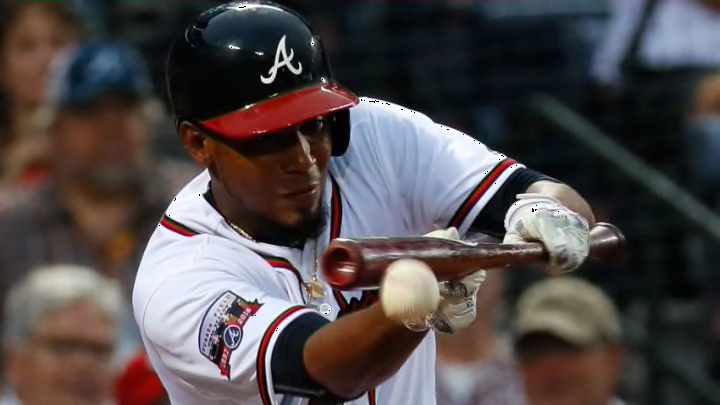
Atlanta Braves pitchers: to bunt or not to bat at all?

Bunting is almost only decorative now
The Atlanta Braves led all of baseball in 2017 with 55 pitcher bunts
I went to fangraphs and started checking on National League-only stats for pitchers at the plate.
I also added in a new column not included by default: Bunts.
Not sacrifice bunts; not bunting for a hit (though that almost never happens with a pitcher involved anyway)…. just bunts.
[ Of note: there’s no good way to track strikeouts that are the result of a failed bunt attempt, so we’ll have to hope and imagine that this stat is irrelevant to today’s point. ]
So here’s what I found:
- 2005: 5,829 NL pitcher plate appearances; 768 bunts (13.1%)
- 2010: 5,748 NL pitcher plate appearances; 780 bunts (13.5%)
- 2015: 5,054 PAs; 650 bunts (12.8%)
- 2016: 4,993 PAs; 606 bunts (12.1%)
- 2017: 4,920 PAs; 608 bunts (12.4%)
- 2018: 1,048 PAs; 113 bunts (10.8%)
It appears that pitcher plate appearances are holding steady so far this season, though a number of factors make it difficult to accurately pro-rate this for the full season.
But it’s true what Sherman declares: pitcher bunting is down – well over 2% over just the past 5+ years. This on top of the fact that pitcher trips to the plate are down 15.5% between 2005 and 2017. We’ll get to that in a bit.
But Sherman declares that sacrificial bunting is simply a bygone strategy now. I’m here to suggest that it’s something else. There’s 3 things.
3 Reasons
Reason #1 is about the plate appearances themselves.
Across all of baseball, team On-base percentage (OBP) is down. Right now, it’s .318 for both leagues. But check the trend:
- 2018: .318
- 2017: .324
- 2016: .322
- 2015: .317
- 2010: .325
- 2005: .330
So hitters – the real hitters, not the pitchers – are on base less often. The worst of these hitters (relatively speaking) would generally be hitting in the slot or 2 in front of the pitcher, so you can imagine that the chances for a pitcher to have an opportunity to bunt are also reduced… perhaps even more so (speculation).
Reason #2: You cannot discount the manner in which pitchers are being used – especially this season. They simply aren’t getting as many opportunities to hit.
Note: if you were paying attention, I suggested that 2018 PAs appeared to be holding steady so far, as compared to 2017. Yes, I said that.
What I believe is happening, though, is that starting pitchers are generally getting 2 ABs, then a relief pitcher is coming in. Whether that reliever gets a trip to the plate isn’t relevant. His lack of ‘reps’ with the bat mean that his chances of laying down a bunt are slim at best when he does grip that wooden foreign object.
But oftentimes, pinch hitters are being used and double switches move the pitcher’s spot around the order like a roulette wheel… with NL managers doing anything they can to keep hitters at the plate – not pitchers.
This is my complaint today: it’s not enough that pitchers aren’t being allowed to go deeper into games. On top of that, NL managers appear to be resigned to a DH mentality as well and have effectively eliminated one of their weapons (albeit a weaker weapon) in the offensive fight.
One possible side-effect: instead of using their available bench bats in a high-leverage role, NL managers may be tending to use them specifically when a pitcher would otherwise be batting… whether there’s a high leverage situation or not.