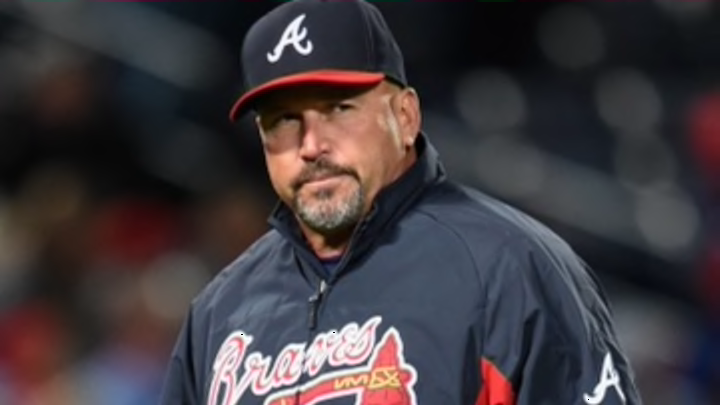
Atlanta Braves Replacing Gonzalez Not about 2016
By Fred Owens

2013
In 2013 the NL East was a mess. At the end of the first half the Nationals couldn’t get out of their own way. In spite of having talent all over the diamond and a pitching staff most envied they were merely a .500 team (48-47) and in second place – six games back of the Braves.
The aging Phillies rotation was starting unravel, Cliff Lee was still a force but Cole Hamels struggled in the first half and posted a 4.05 ERA and the Phillies lineup only gave him a win four of his 20 starts. Roy Halladay pitched only seven games in the first half, winning just 2 and posting an 8.65 ERA in 34 1/3 IP. He returned late and started six games but threw just 27 innings and pitched to a 4.55 ERA. Like the rotation the lineup was getting old (average age just a tick under 31) and included one 300+ hitter – Ben Revere. With all their difficulties the Phillies lost the season series to Atlanta by a slim 8-11 margin.
The Mets had pitching and defense issues of their own yet they were nearly able to stay as close to .500 as possible (9-10) in their games against the Braves.
More from Tomahawk Take
- Atlanta Braves 2012 Prospect Review: Joey Terdoslavich
- Braves News: Braves sign Fuentes, Andruw’s HOF candidacy, more
- The Weakest Braves Homers Since 2015
- Atlanta Braves Sign Joshua Fuentes to Minor League Deal
- Braves News: New Year’s Eve comes with several questions about the 2023 Braves
The Marlins pitching was led by Jose Fernandez but the rest were middle to back end high era arms until Henderson Alvarez came on board in July. Their lineup a mess; the highest BA was Placido Polanco with a .260 and Giancarlo Stanton was the only one slugging over .396.
The Braves coasted through this AAAA division finishing 47-29 against NL East teams. They also whipped on the still rebuilding Cubs (5-1) and perennially hapless Rockies (6-1) while taking an interleague series from Cleveland 3-0 and the Twins 3-0, giving them 73 victories over the league’s whipping boys. It’s not a stretch to suggest that winning the weakest division in baseball didn’t exactly require a managerial masterpiece, and win they did in spite of carrying Dan Uggla and Melvin Upton, both of whom played at below replacement level. Then came the LDS and elimination via the David Carpenter hanging slider while Craig Kimbrel was left glaring in from the bullpen.
2014
While fans and pundits refer the to Braves second half collapse, the numbers say it started a lot sooner. On July first the Braves were 46-38, a half game up on the Nationals with a run differential (308-305). From that date forward they were 33-45 with a -27 run differential (265-292) and finished the season 79-83: tied for second place, 17 games behind the Nationals.
I’ve seen the argument put forward that the loss of Kris Medlen and Brandon Beachy changed the way the season played out, but that’s not supported by the facts. Those pitchers were were replaced by Ervin Santana and Aaron Harang who pitched as well as the original pair could have been expected to do. The problem came from lack of runs and specifically their inability to come back.
| Ahead | Tied | Behind | |||||||
|---|---|---|---|---|---|---|---|---|---|
| Inning | W | L | % | W | L | % | W | L | % |
| 1 | 0 | 0 | 79 | 83 | 0.488 | 0 | 0 | ||
| 2 | 21 | 7 | 0.750 | 46 | 51 | 0.474 | 12 | 25 | 0.324 |
| 3 | 36 | 9 | 0.800 | 28 | 35 | 0.444 | 15 | 39 | 0.278 |
| 4 | 43 | 17 | 0.717 | 23 | 24 | 0.489 | 13 | 42 | 0.236 |
| 5 | 56 | 14 | 0.800 | 14 | 19 | 0.424 | 9 | 50 | 0.153 |
| 6 | 61 | 9 | 0.871 | 11 | 22 | 0.333 | 7 | 52 | 0.119 |
| 7 | 62 | 7 | 0.899 | 14 | 16 | 0.467 | 3 | 60 | 0.048 |
| 8 | 70 | 3 | 0.959 | 7 | 8 | 0.467 | 2 | 72 | 0.027 |
| 9 | 72 | 1 | 0.986 | 5 | 8 | 0.385 | 2 | 74 | 0.026 |
| 10 | 0 | 0 | 7 | 10 | 0.412 | 0 | 0 | ||
| 11 | 0 | 0 | 2 | 7 | 0.222 | 0 | 0 | ||
| 12 | 0 | 0 | 2 | 4 | 0.333 | 0 | 0 | ||
| 13 | 0 | 0 | 1 | 3 | 0.250 | 0 | 0 | ||
| 14 | 0 | 0 | 0 | 1 | 0.000 | 0 | 0 |
Statistics from Baseball-Reference.com’s play index tool
Essentially if the Braves didn’t score score first and hold it through six innings they were done; that’s on the lineup and the roster.
Next: Why Now?