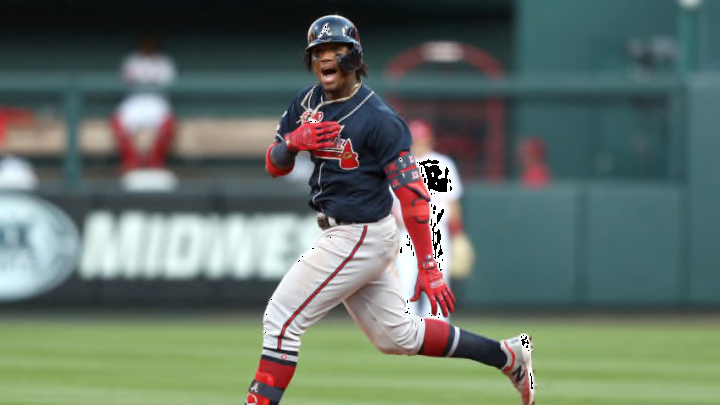
Atlanta Braves 2019 Report Card: Offensive and individual player grades
By Clint Manry

Team offense
Grade: B+
The 2019 version of the Atlanta Braves offense was a lot like the 2018 group, except this year’s hitters enjoyed a bit more success, thanks to the new rabid ball that was used and some even better results against certain pitches.
The top-half of the Braves’ lineup — which we’ve written extensively about lately — provided a lot more pop this season, as well as late-innings heroics.
While the Braves did fairly well in the latter portion of games in 2018, the 2019 lineup seemingly fed off of the pressure. No matter the deficit, it seemed as if this year’s offense could always find a way to win.
The fundamentals
Overall, looking at several your more standard statistics, the 2019 Braves were a top-10 group in the majors and one of the best in the Senior Circuit:
| STAT | VALUE | MLB RANK |
|---|---|---|
| Home runs | 249 | 8th |
| Runs | 855 | 7th |
| RBI | 824 | 6th |
| Walk-rate | 9.8% | 3rd best |
| Strikeout-rate | 23.3% | t-13th worst |
| Batting average | .258 | 7th |
| On-base% | .336 | 6th |
| Slugging% | .452 | t-8th |
| wRC+ | 102 | t-9th |
| Offensive WAR | 26.9 | 7th |
When the 2019 regular season was all over, the Braves slugged 74 more home runs than they did in 2018 and 14 more than in 2003 — the season of the old franchise home run record (235).
It wasn’t just home runs, either. The 2019 season was a big year for runs in general, as well as RBI. The Braves scored the 10th-most runs in franchise history (855) and knocked in the 5th-most runs (824) — 96 more runs and 107 more RBI than in 2018.
Contrary to their performance in this year’s NLDS, the Braves rostered a lineup that could produce consistently.
Batted-balls and ‘clutchness’
The biggest difference between the 2019 Braves and 2018’s squad was how hard this year’s team hit the ball on a nightly basis:
- 2018 hard-hit rate: 36.4% (12th in MLB)
- 2019 hard-hit rate: 41.4% (2nd in MLB)
Of note: that’s not about the juiced baseball, for every team used the same balls. These are hard-hit rates as compared to other teams.
And not only did the 2019 Braves hit the ball hard, but the lineup feasted on fastballs, tripling their runs-above-average rating from last season against the heater:
- 2018 vs. fastball: 27.6 (12th in MLB)
- 2019 vs. fastball: 71.3 (7th in MLB)
Other Braves’ batted-ball ranks
| STAT | VALUE | RANK |
|---|---|---|
| WPA | 14.76 | 5th |
| Clutch | 1.63 | 4th |
| Line-drive% | 23.6% | 1st |
| Flyball% | 35.8% | 13th |
| Pull% | 41.6% | 7th |
| Oppo% | 25.8% | 6th |
| Cent% | 32.5% | 30th |
| vs. Slider | -19.8 | 15th |
| vs. Cutter | -4.3 | 16th |
| vs. Curve | 14.6 | 3rd |
| vs. Change | -1.2 | 13th |
Now you might not put much faith in FanGraphs‘ ability to measure clutchness with their ‘Clutch’ stat. I, myself, don’t know exactly what goes into the metric.
But WPA (win-probability-added) tells enough of the story. That’s basic math. And the 2019 Braves were one of the best when it came to causing positive swings to its win expectancy — the basic principle of how WPA is compiled.
Most of the Braves’ batted-ball results from 2019 fall in line with their 2018 tendencies — the lineup was mostly pull-heavy, but hit a lot of hard line-drives.
Plate discipline
The 2019 Braves corrected some of the chase issues the team had from 2018. This year’s lineup swung less at pitches out of the zone, which had a lot to do with the team’s increase in walk-rate from 2018 (8.2 BB% to 9.8 BB% in 2019).
Last season, the Braves finished the year with the 5th-highest O-Swing% (out-of-zone swing rate) in the majors (32.4%). In 2019, the team improved… even if it was just a tad:
2019 Braves’ plate discipline ranks
STAT
VALUE
MLB RANK
O-swing% (swings at balls out of the strike zone)
31.3%
t-15th highest
Z-swing% (swings at balls in the strike zone)
71.2%
3rd
Overall Swing%
47.8%
t-10th
O-contact% (contact outside the strike zone)
64.2%
t-7th
Z-contact% (contact in the strike zone)
82.4%
lowest in MLB
Overall contact% 75.4% 15th
Swinging strike%
11.8% t-5th highest
Unfortunately, the team took a dip in terms of contact against pitches in the zone (or strikes). Last season, the Braves made contact with swings at pitches in the zone at an 85.3% clip (3% more than in 2019).
The fact that the Braves ranked third when it came to swinging at pitches in the zone, but was the worst in the majors at actually hitting them, explains a lot of the swing-and-miss and spoiled opportunities at the plate.
Also, you’d like to see the lineup do a bit better with its overall contact, as 15th in the majors isn’t an ideal standing amongst the league.
Why the B+ grade? For reasons I just illustrated: this team was no doubt one of the elite groups on offense — the numbers show that.
But, as you can see by the last group of stats, the Braves’ plate discipline in 2019 was an evident weakness. And this is purely anecdotal, but to me it appeared to have played a part in some of the lineup’s issues in the NLDS.
I would grade 2018’s offense as a B, and I think the 2019 lineup was certainly better, hence the B+.
Let’s look at the individual players…